# Command to run to install the required packages:
# !pip install torch torchvision numpy plotly dash dash-bootstrap-components PillowAppendix A — Gradient-based XAI techniques
This notebook is part of the MINERVA best-practice guides and is released under the Apache License, Version 2.0. The accompanying written guide is released under CC BY 4.0.
# ============================================
# Imports
# ============================================
import dash
import dash_bootstrap_components as dbc
import numpy as np
import plotly.graph_objects as go
import plotly.io as pio
import torch
import torch.nn as nn
import torch.nn.functional as F
import torchvision
import torchvision.transforms as transforms
from dash import Input, Output, State, dcc, html
from plotly.subplots import make_subplots

pio.renderers.default = "notebook_connected"

torch.manual_seed(0)
<torch._C.Generator at 0x114ad3a70># ============================================
# Model Definition, Data Loading, and Training
# ============================================
# This section defines a lightweight convolutional neural network
# specifically designed to support interpretability methods such as:
# - CAM (Class Activation Mapping)
# - Grad-CAM / Grad-CAM++
# - Gradient-based approaches (e.g., Integrated Gradients)
#
# The model is intentionally simple to make internal representations
# and saliency visualizations easier to understand.
class TinyGradCAMNet(nn.Module):
"""Network that supports CAM, GradCAM, and gradient-based methods"""
def __init__(self):
super().__init__()
self.conv1 = nn.Conv2d(1, 8, 3, padding=1)
self.conv2 = nn.Conv2d(8, 16, 3, padding=1)
self.conv3 = nn.Conv2d(16, 32, 3, padding=1)
self.gap = nn.AdaptiveAvgPool2d(1)
self.fc = nn.Linear(32, 10)
self.act = nn.LeakyReLU(0.1)
# For GradCAM
self.feature_maps = None
self.gradients = None
def save_gradient(self, grad):
self.gradients = grad
def forward(self, x, return_features=False):
f1 = self.act(self.conv1(x))
f2 = self.act(self.conv2(f1))
f3 = self.act(self.conv3(f2))
self.feature_maps = f3
if f3.requires_grad:
f3.register_hook(self.save_gradient)
x = self.gap(f3).view(x.size(0), -1)
scores = self.fc(x)
if return_features:
return scores, f1, f2, f3
return scores
def load_data():
"""Load MNIST dataset"""
transform = transforms.Compose([transforms.ToTensor()])
mnist_train = torchvision.datasets.MNIST(root="./data", train=True, download=True, transform=transform)
mnist_test = torchvision.datasets.MNIST(root="./data", train=False, download=True, transform=transform)
# Use all digits
train_indices = torch.ones(len(mnist_train), dtype=torch.bool)
test_indices = torch.ones(len(mnist_test), dtype=torch.bool)
X_train = mnist_train.data[train_indices].unsqueeze(1).float() / 255.0
y_train = mnist_train.targets[train_indices]
X_test = mnist_test.data[test_indices].unsqueeze(1).float() / 255.0
y_test = mnist_test.targets[test_indices]
return X_train, y_train, X_test, y_test
def train_model(model, X_train, y_train, epochs=5, batch_size=64):
"""Train the model"""
optimizer = torch.optim.Adam(model.parameters(), lr=0.01)
criterion = nn.CrossEntropyLoss()
print("Training model...")
for epoch in range(epochs):
perm = torch.randperm(X_train.size(0))
total_loss = 0
for i in range(0, X_train.size(0), batch_size):
idx = perm[i:i+batch_size]
xb, yb = X_train[idx], y_train[idx]
optimizer.zero_grad()
scores = model(xb)
loss = criterion(scores, yb)
loss.backward()
optimizer.step()
total_loss += loss.item()
print(f"Epoch {epoch+1}/{epochs}, Loss: {total_loss/(i//batch_size+1):.4f}")
print("Training complete!")
return modelA.1 CAM
def compute_cam(model, x, class_idx):
    """
    Class Activation Mapping (CAM) — Zhou et al., 2015.

    CAM is an *intrinsic* interpretability method: it requires the model to use
    Global Average Pooling (GAP) immediately before the final linear classifier.
    This architectural constraint is what makes the method work without backprop.

    Intuition: each feature map A^k detects different spatial patterns. The
    classifier weights w_k^c encode how much map k matters for class c. Their
    weighted sum produces a spatial heatmap over the image.

    Math:
        M_{i,j}^c = sum_k  w_k^c * A_{i,j}^k
        L_CAM^c   = ReLU( M^c )

    Note: no backward pass is needed — we reuse the weights already learned
    by the classifier, which is why CAM has the lowest compute cost of all
    methods covered here.
    """
    model.eval()
    with torch.no_grad():
        scores, _, _, f3 = model(x, return_features=True)

    weights = model.fc.weight[class_idx]
    cam = torch.zeros(f3.shape[2:])

    for k in range(f3.shape[1]):
        cam += weights[k] * f3[0, k]

    cam = F.relu(cam)
    cam = cam.detach().cpu().numpy()

    cam -= cam.min()
    if cam.max() > 0:
        cam /= cam.max()

    return cam
A.2 Grad-CAM
def compute_gradcam(model, x, class_idx):
    """
    Gradient-weighted Class Activation Mapping (Grad-CAM) — Selvaraju et al., 2017.

    Grad-CAM generalises CAM to *any* CNN architecture without requiring GAP or
    architectural modifications. It replaces the fixed classifier weights w_k^c
    with gradient-derived importance scores alpha_k^c.

    Intuition: "if we slightly increase activation A_{i,j}^k, how much does the
    class score y^c increase?" Averaging these sensitivities over all spatial
    locations gives a global importance weight per feature map.

    Math:
        alpha_k^c  = (1/Z) * sum_{i,j}  ∂y^c / ∂A_{i,j}^k
        L_GradCAM  = ReLU( sum_k  alpha_k^c * A^k )

    Cost: 1 forward pass + 1 backward pass  →  ~3x a baseline forward pass.
    Limitation: uniform spatial averaging can miss fine-grained localisation and
    struggles when multiple instances of the same class are present.
    """
    model.eval()
    model.zero_grad()

    x.requires_grad_(True)
    scores = model(x)
    score = scores[:, class_idx]
    score.backward(retain_graph=True)

    grads = model.gradients
    fmap = model.feature_maps

    weights = grads.mean(dim=(2, 3), keepdim=True)
    cam = (weights * fmap).sum(dim=1)

    cam = F.relu(cam).squeeze()
    cam = cam.detach().cpu().numpy()

    cam -= cam.min()
    if cam.max() > 0:
        cam /= cam.max()

    return cam
A.3 Grad-CAM++
def compute_gradcam_plusplus(model, x, class_idx):
    """
    Grad-CAM++ — Chattopadhay et al., 2018.

    Addresses Grad-CAM's limitation by replacing the uniform spatial average
    with *pixel-wise importance coefficients* derived from second- and
    third-order gradients. This gives more weight to spatial locations that
    contribute most strongly to the prediction, improving localisation and
    handling of multiple objects of the same class.

    Intuition: "not all gradients are equally informative — which spatial
    locations provide the strongest evidence?" Second-order derivatives capture
    how the gradient itself changes; the third-order term normalises the weights.

    Math:
        alpha_{i,j}^{k,c} = (d²y^c / dA_{i,j}^k²)
                             / ( 2*(d²y^c / dA_{i,j}^k²)
                                 + sum_{a,b} A_{a,b}^k * (d³y^c / dA_{i,j}^k³) )

        alpha_k^c    = sum_{i,j}  alpha_{i,j}^{k,c} * ReLU(dy^c / dA_{i,j}^k)
        L_GradCAM++  = ReLU( sum_k  alpha_k^c * A^k )

    Cost: same pass count as Grad-CAM but ~4x peak memory due to storing
    second- and third-order gradient tensors.
    """
    model.eval()
    model.zero_grad()

    x.requires_grad_(True)
    scores = model(x)
    score = scores[:, class_idx]

    score.backward(retain_graph=True)
    grads = model.gradients
    fmap = model.feature_maps

    grads_power_2 = grads ** 2
    grads_power_3 = grads ** 3

    sum_activations = fmap.sum(dim=(2, 3), keepdim=True)

    alpha_num = grads_power_2
    alpha_denom = 2 * grads_power_2 + sum_activations * grads_power_3 + 1e-8
    alpha = alpha_num / alpha_denom

    weights = (alpha * F.relu(grads)).sum(dim=(2, 3), keepdim=True)
    cam = (weights * fmap).sum(dim=1)

    cam = F.relu(cam).squeeze()
    cam = cam.detach().cpu().numpy()

    cam -= cam.min()
    if cam.max() > 0:
        cam /= cam.max()

    return cam
A.4 Integrated Gradients
def compute_integrated_gradients(model, x, class_idx, baseline=None, steps=50):
    """
    Integrated Gradients (IG) — Sundararajan et al., 2017.

    Unlike CAM-based methods, IG is *architecture-agnostic*: it works on any
    differentiable model (CNNs, transformers, MLPs, …) without requiring
    specific layers or architectural changes.

    Core idea: instead of reading the gradient at a single point (which can be
    noisy), IG accumulates gradients along the straight-line path from a
    reference baseline x' to the actual input x. This tracks how the prediction
    evolves as each input feature is progressively "switched on".

    The zero tensor (black image) is the default baseline — it represents the
    absence of information. Baseline choice matters: different baselines can
    yield different attributions.

    Math:
        path:         gamma(alpha) = x' + alpha*(x - x'),  alpha in [0,1]
        approximation: g_i_bar = (1/m) * sum_{k=1}^{m} dF(gamma(k/m)) / dx_i
        attribution:  IG_i(x)  = (x_i - x'_i) * g_i_bar

    Axiomatic guarantees (unlike CAM methods):
      - Sensitivity: if x and x' differ in one feature and the output differs,
        that feature receives non-zero attribution.
      - Implementation invariance: equivalent networks yield identical
        attributions.

    Cost: S forward+backward passes  →  ~3Sx a baseline forward pass.
    With S=50, this is ~150x more expensive than a single forward pass.
    """
    model.eval()

    if baseline is None:
        baseline = torch.zeros_like(x)

    total_gradients = torch.zeros_like(x)

    x_d = x.detach()
    b_d = baseline.detach()

    for k in range(1, steps + 1):
        alpha = k / steps
        x_interpolated = b_d + alpha * (x_d - b_d)
        x_interpolated = x_interpolated.requires_grad_(True)

        output = model(x_interpolated)
        score = output[0, class_idx]

        model.zero_grad()
        score.backward()

        total_gradients += x_interpolated.grad.detach()

    avg_gradients = total_gradients / steps
    attributions = (x_d - b_d) * avg_gradients

    attr = attributions.squeeze().detach().cpu().numpy()

    attr_abs = np.abs(attr)
    if attr_abs.max() > 0:
        attr = attr / attr_abs.max()

    return attr
A.5 SmoothGrad over IG, GradCAM, Grad-CAM++
def compute_smoothgrad_ig(model, x, class_idx, n_samples=25, noise_std=0.1, steps=50):
    """
    SmoothGrad applied to Integrated Gradients — Smilkov et al., 2017.

    SmoothGrad is a *variance reduction wrapper*, not a standalone method. It
    can be applied on top of any gradient-based attribution method (here: IG).

    Intuition: true explanatory signals are robust to small input perturbations,
    whereas gradient noise varies under perturbations. By averaging attributions
    computed from N slightly noisy copies of the input, consistent (signal)
    components reinforce each other while noisy components cancel out.
    Gaussian noise is used because it provides unbiased perturbations.

    Math:
        M_SmoothGrad(x) ≈ (1/N) * sum_{k=1}^{N}  M(x + eps^(k))
        where eps^(k) ~ N(0, sigma^2 * I)

    When applied to IG, the axiomatic properties of the base method are
    preserved while producing smoother, more visually stable maps.

    Cost: N * (cost of base method)  →  here N*S*3 forward-pass equivalents.
    With N=25, S=50: ~3750x a baseline forward pass.
    """
    model.eval()
    baseline = torch.zeros_like(x)
    attributions = []

    for _ in range(n_samples):
        noise = torch.randn_like(x) * noise_std
        noisy_x = x + noise

        ig = compute_integrated_gradients(model, noisy_x, class_idx, baseline, steps)
        attributions.append(ig)

    avg_attr = np.mean(attributions, axis=0)
    attr_abs = np.abs(avg_attr)
    if attr_abs.max() > 0:
        avg_attr = avg_attr / attr_abs.max()

    return avg_attr

def compute_smoothgrad_gradcam(model, x, class_idx, n_samples=25, noise_std=0.1):
    """
    SmoothGrad applied to Grad-CAM.

    Averages Grad-CAM heatmaps over N noisy perturbations of the input to
    reduce gradient noise and produce more stable spatial attributions.
    See compute_smoothgrad_ig for the general SmoothGrad rationale.

    Cost: N * (1 fwd + 1 bwd)  →  ~3Nx a baseline forward pass.
    """
    maps = []
    for _ in range(n_samples):
        noisy = (x + torch.randn_like(x) * noise_std).detach()
        maps.append(compute_gradcam(model, noisy, class_idx))
    avg = np.mean(maps, axis=0)
    avg -= avg.min()
    if avg.max() > 0: avg /= avg.max()
    return avg


def compute_smoothgrad_gradcam_plusplus(model, x, class_idx, n_samples=25, noise_std=0.1):
    """
    SmoothGrad applied to Grad-CAM++.

    Averages Grad-CAM++ heatmaps over N noisy perturbations of the input.
    Combines Grad-CAM++'s improved pixel-wise localisation with SmoothGrad's
    noise reduction. See compute_smoothgrad_ig for the general rationale.

    Cost: N * (Grad-CAM++ cost)  →  ~3Nx a baseline forward pass, with
    ~4x the peak memory of SmoothGrad + Grad-CAM due to higher-order gradients.
    """
    maps = []
    for _ in range(n_samples):
        noisy = (x + torch.randn_like(x) * noise_std).detach()
        maps.append(compute_gradcam_plusplus(model, noisy, class_idx))
    avg = np.mean(maps, axis=0)
    avg -= avg.min()
    if avg.max() > 0:
        avg /= avg.max()
    return avg
A.6 Tests
# ============================================
# Training of the model
# ============================================

print("Loading data...")
X_train, y_train, X_test, y_test = load_data()

print("Initializing model... (might take a ~2/3 minutes on a local machine)")
model = TinyGradCAMNet()
model = train_model(model, X_train, y_train, epochs=5)

model.eval()
Loading data...
Initializing model... (might take a ~2/3 minutes on a local machine)
Training model...
Epoch 1/5, Loss: 1.0569
Epoch 2/5, Loss: 0.3285
Epoch 3/5, Loss: 0.2250
Epoch 4/5, Loss: 0.1840
Epoch 5/5, Loss: 0.1652
Training complete!TinyGradCAMNet(
(conv1): Conv2d(1, 8, kernel_size=(3, 3), stride=(1, 1), padding=(1, 1))
(conv2): Conv2d(8, 16, kernel_size=(3, 3), stride=(1, 1), padding=(1, 1))
(conv3): Conv2d(16, 32, kernel_size=(3, 3), stride=(1, 1), padding=(1, 1))
(gap): AdaptiveAvgPool2d(output_size=1)
(fc): Linear(in_features=32, out_features=10, bias=True)
(act): LeakyReLU(negative_slope=0.1)
)# ============================================
# Helper functions to plot the results
# ============================================
def create_all_saliency_comparison(img, target_class):
x_t = torch.tensor(img, dtype=torch.float32).unsqueeze(0).unsqueeze(0)
methods = {
'Input': img,
'CAM': compute_cam(model, x_t, target_class),
'Grad-CAM': compute_gradcam(model, x_t, target_class),
'Grad-CAM++': compute_gradcam_plusplus(model, x_t, target_class),
'Integrated Gradients': compute_integrated_gradients(model, x_t, target_class),
'SmoothGrad + IG': compute_smoothgrad_ig(model, x_t, target_class),
'SmoothGrad + GradCAM': compute_smoothgrad_gradcam(model, x_t, target_class),
'SmoothGrad + GradCAM++': compute_smoothgrad_gradcam_plusplus(model, x_t, target_class),
}
titles = list(methods.keys())
n_cols, n_rows = 4, 2
fig = make_subplots(
rows=n_rows, cols=n_cols,
subplot_titles=titles,
horizontal_spacing=0.04,
vertical_spacing=0.12,
)
legend_added = {'Gray': False, 'RdBu_r': False}
for idx, (method, smap) in enumerate(methods.items()):
row = idx // n_cols + 1
col = idx % n_cols + 1
if smap.shape != img.shape:
from scipy.ndimage import zoom
scale = img.shape[0] / smap.shape[0]
smap = zoom(smap, scale, order=1)
if method == 'Input':
show_gray = not legend_added['Gray']
fig.add_trace(
go.Heatmap(
z=smap,
colorscale='Gray',
showscale=show_gray,
colorbar=dict(
title=dict(text='Intensity', side='right'),
thickness=12,
len=0.4,
x=1.02,
y=0.78,
yanchor='middle',
tickfont=dict(size=9),
) if show_gray else None,
),
row=row, col=col,
)
legend_added['Gray'] = True
else:
fig.add_trace(
go.Heatmap(z=img, colorscale='Gray', showscale=False, opacity=0.45),
row=row, col=col,
)
show_rdbu = not legend_added['RdBu_r']
fig.add_trace(
go.Heatmap(
z=smap,
colorscale='RdBu_r',
showscale=show_rdbu,
opacity=0.65,
colorbar=dict(
title=dict(text='Saliency', side='right'),
thickness=12,
len=0.4,
x=1.02,
y=0.25,
yanchor='middle',
tickfont=dict(size=9),
) if show_rdbu else None,
),
row=row, col=col,
)
legend_added['RdBu_r'] = True
fig.update_xaxes(showticklabels=False, showgrid=False, zeroline=False, scaleanchor=None)
fig.update_yaxes(showticklabels=False, showgrid=False, zeroline=False, scaleanchor=None, autorange='reversed')
fig.update_layout(
height=460,
margin=dict(l=10, r=80, t=55, b=10),
)
return fig
def create_all_channels_figure(feature_tensor, layer_name):
"""Display all feature map channels for a given conv layer."""
fmap = feature_tensor[0].detach().cpu().numpy() # (C, H, W)
n_channels = fmap.shape[0]
n_cols = 8
n_rows = int(np.ceil(n_channels / n_cols))
titles = [f'Ch {i}' for i in range(n_channels)]
fig = make_subplots(
rows=n_rows, cols=n_cols,
subplot_titles=titles,
horizontal_spacing=0.02,
vertical_spacing=0.08,
)
for i in range(n_channels):
row = i // n_cols + 1
col = i % n_cols + 1
ch = fmap[i]
ch_norm = ch - ch.min()
if ch_norm.max() > 0:
ch_norm /= ch_norm.max()
fig.add_trace(
go.Heatmap(
z=ch_norm,
colorscale='Viridis',
showscale=False,
),
row=row, col=col,
)
fig.update_xaxes(showticklabels=False, showgrid=False, zeroline=False)
fig.update_yaxes(showticklabels=False, showgrid=False, zeroline=False, autorange='reversed')
fig.update_layout(
title=dict(text=f'{layer_name} Feature Maps ({n_channels} channels)', x=0.5),
height=max(150, n_rows * 120),
margin=dict(l=5, r=5, t=40, b=5),
)
return fig# ============================================
# Implementation of DashApp #1
# ============================================
RUN_APP = False # Set to true to run the app
N_TEST = len(X_test)
app = dash.Dash(__name__, external_stylesheets=[dbc.themes.BOOTSTRAP])
app.layout = dbc.Container([
dbc.Row([
dbc.Col([
dbc.Card([
dbc.CardHeader(html.Strong("Controls")),
dbc.CardBody([
html.Label("Sample Index", className="fw-semibold mb-1"),
dbc.InputGroup([
dbc.Input(
id='sample-input',
type='number',
min=0,
max=N_TEST - 1,
step=1,
value=80,
debounce=True,
style={'width': '100%'},
),
dbc.Button("Random pick", id='random-btn', color='secondary',
title="Pick a random sample"),
], className="mb-1"),
html.Small(f"0 – {N_TEST - 1}", className="text-muted"),
html.Hr(),
html.Label("Target Class", className="fw-semibold mb-1"),
dcc.Dropdown(
id='class-dropdown',
options=[{'label': f'Class {i}', 'value': i} for i in range(10)],
value=None,
placeholder="Auto (predicted)",
clearable=True,
),
html.Hr(),
dbc.Button("Update", id='update-btn', color='primary',
className='w-100'),
])
], className="sticky-top", style={'top': '10px'})
], width=2),
dbc.Col([
dbc.Card([
dbc.CardBody(id='prediction-info')
], className="mb-3"),
dbc.Card([
dbc.CardHeader(html.Strong("Saliency Methods")),
dbc.CardBody([
dcc.Graph(id='saliency-plot', style={'height': '460px'})
], style={'padding': '8px'})
])
], width=10)
], className="mb-3"),
*[
dbc.Row([
dbc.Col([
dbc.Card([
dbc.CardBody([
dcc.Graph(id=f'conv{n}-features')
], style={'padding': '8px', 'overflowY': 'auto', 'maxHeight': '600px'})
], className="mb-3")
], width=12)
])
for n in (1, 2, 3)
],
], fluid=True, style={'padding': '20px'})
@app.callback(
Output('sample-input', 'value'),
Input('random-btn', 'n_clicks'),
prevent_initial_call=True,
)
def randomise_sample(_):
return int(np.random.randint(0, N_TEST))
@app.callback(
[Output('prediction-info', 'children'),
Output('saliency-plot', 'figure'),
Output('conv1-features', 'figure'),
Output('conv2-features', 'figure'),
Output('conv3-features', 'figure')],
[Input('update-btn', 'n_clicks')],
[State('sample-input', 'value'),
State('class-dropdown', 'value')],
)
def update_visualization(n_clicks, idx, target_class):
# Clamp index
if idx is None:
idx = 0
idx = int(np.clip(int(idx), 0, N_TEST - 1))
x = X_test[idx:idx+1]
y_true = y_test[idx].item()
model.eval()
with torch.no_grad():
scores, f1, f2, f3 = model(x, return_features=True)
probs = F.softmax(scores, dim=1)[0]
pred_class = scores.argmax(dim=1).item()
pred_prob = probs[pred_class].item()
if target_class is None:
target_class = pred_class
top_probs, top_classes = torch.topk(probs, 3)
colour = 'green' if pred_class == y_true else 'red'
info = html.Div([
html.Div([
html.Span(f"Sample #{idx} | ", style={'fontWeight': 'bold'}),
html.Span(f"True: {y_true} | "),
html.Span(f"Predicted: {pred_class} ({pred_prob:.3f})",
style={'color': colour, 'fontWeight': 'bold'}),
html.Span(f" | Saliency target: {target_class}"),
]),
html.Div([
html.Span("Top-3: "),
*[html.Span(f" {c.item()} : {p.item():.3f}")
for c, p in zip(top_classes, top_probs)],
], style={'marginTop': '4px', 'fontSize': '0.9em', 'color': '#555'}),
])
img = x[0, 0].detach().cpu().numpy()
saliency_fig = create_all_saliency_comparison(img, target_class)
conv1_fig = create_all_channels_figure(f1, 'Conv1')
conv2_fig = create_all_channels_figure(f2, 'Conv2')
conv3_fig = create_all_channels_figure(f3, 'Conv3')
return info, saliency_fig, conv1_fig, conv2_fig, conv3_fig
if RUN_APP:
print("\n" + "="*60)
print("Starting Dash app...")
print("http://127.0.0.1:8050/")
print("="*60 + "\n")
app.run(debug=True, port=8050)# ============================================
# Static Preview of the Dash Application
# ============================================
# This cell shows a *non-interactive snapshot* of the Dash app.
#
# To explore the full interface, run the Dash app cell.
# Here, we reuse the same logic as the Dash callbacks.
# --- Select a sample ---
idx = 80
target_class = None # None = use model's predicted class
# --- Run same logic as Dash callback ---
info, saliency_fig, conv1_fig, conv2_fig, conv3_fig = update_visualization(
n_clicks=1,
idx=idx,
target_class=target_class
)
print("STATIC DASH PREVIEW: MODEL INTERPRETABILITY")
print(f"Sample index: {idx}")
print("This shows a single snapshot of the Dash application output.\n")
print("Components:")
print("- Prediction summary (true vs predicted)")
print("- Saliency maps (pixel importance)")
print("- CNN feature maps (Conv layers 1-3)\n")
saliency_fig.show()
conv1_fig.show()
conv2_fig.show()
conv3_fig.show()STATIC DASH PREVIEW: MODEL INTERPRETABILITY
Sample index: 80
This shows a single snapshot of the Dash application output.
Components:
- Prediction summary (true vs predicted)
- Saliency maps (pixel importance)
- CNN feature maps (Conv layers 1-3)
A.7 Complexities
# !pip install ipywidgets matplotlib torch torchvision thop# ============================================
# Imports
# ============================================
import math
import warnings
from dataclasses import dataclass
from typing import Dict, List, Tuple
import ipywidgets as widgets
import matplotlib.pyplot as plt
import matplotlib.ticker as mticker
import torch
import torch.nn as nn
import torchvision.models as tvm
from IPython.display import clear_output, display
from matplotlib.patches import Patch# ============================================
# Implementation of DashApp #2
# ============================================
RUN_APP = False # Set to True to run the app
warnings.filterwarnings("ignore")
try:
from thop import profile as thop_profile
HAS_THOP = True
except ImportError:
HAS_THOP = False
METHOD_COLORS = {
"Baseline": "#C4EDE2",
"CAM": "#449F88",
"Grad-CAM": "#449F88",
"Grad-CAM++": "#449F88",
"Integrated Gradients": "#E6ADA2",
"SmoothGrad + IG": "#DC8C7D",
"SmoothGrad + Grad-CAM": "#1F3D37",
"SmoothGrad + Grad-CAM++": "#1F3D37",
}
LEGEND_ELEMENTS = [
Patch(facecolor="#C4EDE2", label="Baseline"),
Patch(facecolor="#449F88", label="CAM-based"),
Patch(facecolor="#E6ADA2", label="Integrated Gradient"),
Patch(facecolor="#DC8C7D", label="SmoothGrad + IG"),
Patch(facecolor="#1F3D37", label="SmoothGrad + CAM"),
]
class TinyGradCAMNet(nn.Module):
def __init__(self):
super().__init__()
self.features = nn.Sequential(
nn.Conv2d(1, 8, 3, padding=1), nn.LeakyReLU(0.1),
nn.Conv2d(8, 16, 3, padding=1), nn.LeakyReLU(0.1),
nn.Conv2d(16, 32, 3, padding=1), nn.LeakyReLU(0.1),
)
self.gap = nn.AdaptiveAvgPool2d(1)
self.fc = nn.Linear(32, 10)
self.last_conv_out_channels = 32
def forward(self, x):
f = self.features(x)
return self.fc(self.gap(f).flatten(1))
@dataclass
class ModelSpec:
name: str
factory: object
default_in_ch: int = 3
last_conv_ch: int = 512
typical_feat_div: int = 32
MODEL_REGISTRY: Dict[str, ModelSpec] = {
"TinyGradCAMNet": ModelSpec(
name="TinyGradCAMNet",
factory=TinyGradCAMNet,
default_in_ch=1,
last_conv_ch=32,
typical_feat_div=1,
),
"ResNet-18": ModelSpec("ResNet-18", lambda: tvm.resnet18(weights=None), last_conv_ch=512, typical_feat_div=32),
"ResNet-50": ModelSpec("ResNet-50", lambda: tvm.resnet50(weights=None), last_conv_ch=2048, typical_feat_div=32),
"VGG-16": ModelSpec("VGG-16", lambda: tvm.vgg16(weights=None), last_conv_ch=512, typical_feat_div=32),
"MobileNetV2": ModelSpec("MobileNetV2", lambda: tvm.mobilenet_v2(weights=None), last_conv_ch=1280, typical_feat_div=32),
"EfficientNet-B0": ModelSpec("EfficientNet-B0", lambda: tvm.efficientnet_b0(weights=None), last_conv_ch=1280, typical_feat_div=32),
}
SIZE_OPTIONS = {
"28x28 (MNIST)": 28,
"32x32 (CIFAR)": 32,
"64x64": 64,
"112x112": 112,
"224x224 (ImageNet)": 224,
"384x384": 384,
"512x512": 512,
}
def count_params(model: nn.Module) -> int:
return sum(p.numel() for p in model.parameters())
def count_flops_forward(model: nn.Module, in_ch: int, H: int, W: int) -> int:
dummy = torch.zeros(1, in_ch, H, W)
if HAS_THOP:
try:
macs, _ = thop_profile(model, inputs=(dummy,), verbose=False)
return int(macs)
except Exception:
pass
total = 0
for m in model.modules():
if isinstance(m, nn.Conv2d):
Hout = math.floor((H + 2*m.padding[0] - m.dilation[0]*(m.kernel_size[0]-1) - 1) / m.stride[0] + 1)
Wout = math.floor((W + 2*m.padding[1] - m.dilation[1]*(m.kernel_size[1]-1) - 1) / m.stride[1] + 1)
total += (m.in_channels // m.groups) * m.kernel_size[0] * m.kernel_size[1] * m.out_channels * Hout * Wout
elif isinstance(m, nn.Linear):
total += m.in_features * m.out_features
return total
@dataclass
class MethodComplexity:
name: str
flops_multiplier: float
peak_mem_extra: str
peak_mem_bytes: int
notes: str
def compute_complexities(
spec: ModelSpec, H: int, W: int, S: int = 50, N: int = 25, dtype_bytes: int = 4
) -> Tuple[int, int, int, List[MethodComplexity]]:
Hp = max(1, H // spec.typical_feat_div)
Wp = max(1, W // spec.typical_feat_div)
K = spec.last_conv_ch
model = spec.factory()
model.eval()
in_ch = spec.default_in_ch
flops_fwd = count_flops_forward(model, in_ch, H, W)
flops_bwd = 2 * flops_fwd
n_params = count_params(model)
del model
feat_map_bytes = K * Hp * Wp * dtype_bytes
fc_row_bytes = K * dtype_bytes
methods = [
MethodComplexity(
name="CAM",
flops_multiplier=1.0,
peak_mem_extra=f"O(K·H'·W') = {K}x{Hp}x{Wp}",
peak_mem_bytes=feat_map_bytes + fc_row_bytes,
notes="No backward pass. Requires GAP + linear head.",
),
MethodComplexity(
name="Grad-CAM",
flops_multiplier=3.0,
peak_mem_extra=f"O(K·H'·W') = {K}x{Hp}x{Wp}",
peak_mem_bytes=2 * feat_map_bytes,
notes="1 fwd + 1 bwd. Gradient retained only at last conv.",
),
MethodComplexity(
name="Grad-CAM++",
flops_multiplier=3.0,
peak_mem_extra=f"O(4·K·H'·W') = 4x{K}x{Hp}x{Wp}",
peak_mem_bytes=4 * feat_map_bytes,
notes="1 fwd + 1 bwd. ~4x peak memory vs Grad-CAM.",
),
MethodComplexity(
name="Integrated Gradients",
flops_multiplier=S * 3.0,
peak_mem_extra=f"O(H·W) = {H}x{W}",
peak_mem_bytes=H * W * dtype_bytes,
notes=f"S={S} steps x (fwd+bwd) ≈ {S*3} fwd-equivalents.",
),
MethodComplexity(
name="SmoothGrad + IG",
flops_multiplier=N * S * 3.0,
peak_mem_extra=f"O(N·H·W) = {N}x{H}x{W}",
peak_mem_bytes=N * H * W * dtype_bytes,
notes=f"N={N} x S={S} = {N*S} IG calls ≈ {N*S*3} fwd-equiv.",
),
MethodComplexity(
name="SmoothGrad + Grad-CAM",
flops_multiplier=N * 3.0,
peak_mem_extra=f"O(N·H'·W') = {N}x{Hp}x{Wp}",
peak_mem_bytes=N * Hp * Wp * dtype_bytes,
notes=f"N={N} samples x (fwd+bwd) ≈ {N*3} fwd-equivalents.",
),
MethodComplexity(
name="SmoothGrad + Grad-CAM++",
flops_multiplier=N * 3.0,
peak_mem_extra=f"O(4N·H'·W') = 4x{N}x{Hp}x{Wp}",
peak_mem_bytes=4 * N * Hp * Wp * dtype_bytes,
notes=f"N={N} samples, each Grad-CAM++ ≈ {N*3} fwd-equivalents.",
),
]
return flops_fwd, flops_bwd, n_params, methods
def human(n: int) -> str:
for unit, thresh in [("G", 1e9), ("M", 1e6), ("K", 1e3)]:
if abs(n) >= thresh:
return f"{n/thresh:.2f} {unit}"
return str(n)
def bytes_human(b: int) -> str:
for unit, thresh in [("GB", 1<<30), ("MB", 1<<20), ("KB", 1<<10)]:
if b >= thresh:
return f"{b/thresh:.2f} {unit}"
return f"{b} B"
def plot_complexities(flops_fwd, n_params, methods, model_name, H, W):
labels = ["Baseline"] + [m.name for m in methods]
multipliers = [1.0] + [m.flops_multiplier for m in methods]
mem_bytes = [0] + [m.peak_mem_bytes for m in methods]
colors = [METHOD_COLORS.get(l, "#999999") for l in labels]
fig, (ax1, ax2) = plt.subplots(1, 2, figsize=(15, 5))
fig.suptitle(
f"{model_name} | input {H}×{W} | "
f"baseline forward: {human(flops_fwd)} FLOPs | "
f"params: {human(n_params)}",
fontsize=12, fontweight="bold", y=1.01,
)
bars1 = ax1.barh(labels, multipliers, color=colors, edgecolor="white", height=0.6)
ax1.set_xscale("log")
ax1.set_xlabel("Total FLOPs (× baseline forward pass, log scale)", fontsize=10)
ax1.set_title("Compute cost", fontsize=11, fontweight="bold")
ax1.xaxis.set_major_formatter(mticker.FuncFormatter(lambda x, _: f"{x:g}×"))
ax1.axvline(1, color="grey", linestyle="--", linewidth=0.8, alpha=0.6)
for bar, val in zip(bars1, multipliers):
ax1.text(
max(val * 1.05, 1.1), bar.get_y() + bar.get_height() / 2,
f"{val:,.0f}×", va="center", ha="left", fontsize=8.5, color="#333"
)
ax1.invert_yaxis()
ax1.grid(axis="x", linestyle=":", alpha=0.4)
ax1.spines[["top", "right"]].set_visible(False)
mem_mb = [b / (1 << 20) for b in mem_bytes]
bars2 = ax2.barh(labels, mem_mb, color=colors, edgecolor="white", height=0.6)
ax2.set_xlabel("Extra activation memory (MB, log scale)", fontsize=10)
ax2.set_title("Extra peak memory", fontsize=11, fontweight="bold")
nonzero_mem = [v for v in mem_mb if v > 0]
if nonzero_mem:
ax2.set_xscale("log")
ax2.xaxis.set_major_formatter(mticker.FuncFormatter(lambda x, _: f"{x:.2g} MB"))
for bar, val in zip(bars2, mem_mb):
if val > 0:
ax2.text(
val * 1.05, bar.get_y() + bar.get_height() / 2,
bytes_human(int(val * (1 << 20))), va="center", ha="left", fontsize=8.5, color="#333"
)
else:
ax2.text(
0.02, bar.get_y() + bar.get_height() / 2,
"0", va="center", ha="left", fontsize=8.5, color="#333",
transform=ax2.get_yaxis_transform(),
)
ax2.invert_yaxis()
ax2.grid(axis="x", linestyle=":", alpha=0.4)
ax2.spines[["top", "right"]].set_visible(False)
fig.legend(
handles=LEGEND_ELEMENTS, loc="lower center", ncol=5,
bbox_to_anchor=(0.5, -0.08), fontsize=9, framealpha=0.4
)
plt.tight_layout()
plt.show()
def show():
w_model = widgets.Dropdown(
options=list(MODEL_REGISTRY.keys()),
value="ResNet-50",
description="Model:",
style={"description_width": "80px"},
layout=widgets.Layout(width="280px"),
)
w_size = widgets.Dropdown(
options=list(SIZE_OPTIONS.keys()),
value="224×224 (ImageNet)",
description="Input size:",
style={"description_width": "80px"},
layout=widgets.Layout(width="280px"),
)
w_S = widgets.IntSlider(
value=50, min=5, max=200, step=5,
description="IG steps (S):",
style={"description_width": "100px"},
layout=widgets.Layout(width="340px"),
continuous_update=False,
)
w_N = widgets.IntSlider(
value=25, min=5, max=100, step=5,
description="SmoothGrad N:",
style={"description_width": "100px"},
layout=widgets.Layout(width="340px"),
continuous_update=False,
)
w_out = widgets.Output()
def recompute(*_):
spec = MODEL_REGISTRY[w_model.value]
H = W = SIZE_OPTIONS[w_size.value]
with w_out:
clear_output(wait=True)
flops_fwd, _, n_params, methods = compute_complexities(spec, H, W, S=w_S.value, N=w_N.value)
plot_complexities(flops_fwd, n_params, methods, spec.name, H, W)
for w in (w_model, w_size, w_S, w_N):
w.observe(recompute, names="value")
ui = widgets.VBox(
[
widgets.HTML("<h3 style='margin-bottom:4px'>Explanation Method Complexity Estimator</h3>"),
widgets.HTML("<hr style='margin:4px 0'>"),
widgets.HBox([w_model, w_size]),
widgets.HBox([w_S, w_N]),
widgets.HTML("<hr style='margin:4px 0'>"),
w_out,
],
layout=widgets.Layout(padding="12px"),
)
display(ui)
recompute()
if RUN_APP:
show()# ============================================
# Static Preview: Explanation Method Complexity
# ============================================
# This cell shows a *non-interactive snapshot* of the complexity
# analysis tool defined above.
#
# To explore different models, input sizes, and parameters (S, N),
# run the interactive widget cell below.
# --- Fixed configuration ---
model_name = "ResNet-50"
input_size_label = "224x224 (ImageNet)"
S = 50 # Integrated Gradients steps
N = 25 # SmoothGrad samples
spec = MODEL_REGISTRY[model_name]
H = W = SIZE_OPTIONS[input_size_label]
# --- Compute complexity metrics ---
flops_fwd, flops_bwd, n_params, methods = compute_complexities(
spec, H, W, S=S, N=N
)
# --- Title and explanation ---
print("\n=== Static Example: Explanation Method Complexity ===\n")
print(f"Model: {model_name}")
print(f"Input size: {H} × {W}")
print(f"Integrated Gradients steps (S): {S}")
print(f"SmoothGrad samples (N): {N}\n")
print("This plot compares different interpretability methods in terms of:")
print("- Compute cost (FLOPs relative to a single forward pass)")
print("- Additional memory required during execution\n")
print("Notes:")
print("- 'Baseline' corresponds to a standard forward pass")
print("- Methods using gradients require forward + backward passes")
print("- SmoothGrad multiplies cost by the number of noisy samples\n")
# --- Display plot ---
plot_complexities(flops_fwd, n_params, methods, spec.name, H, W)
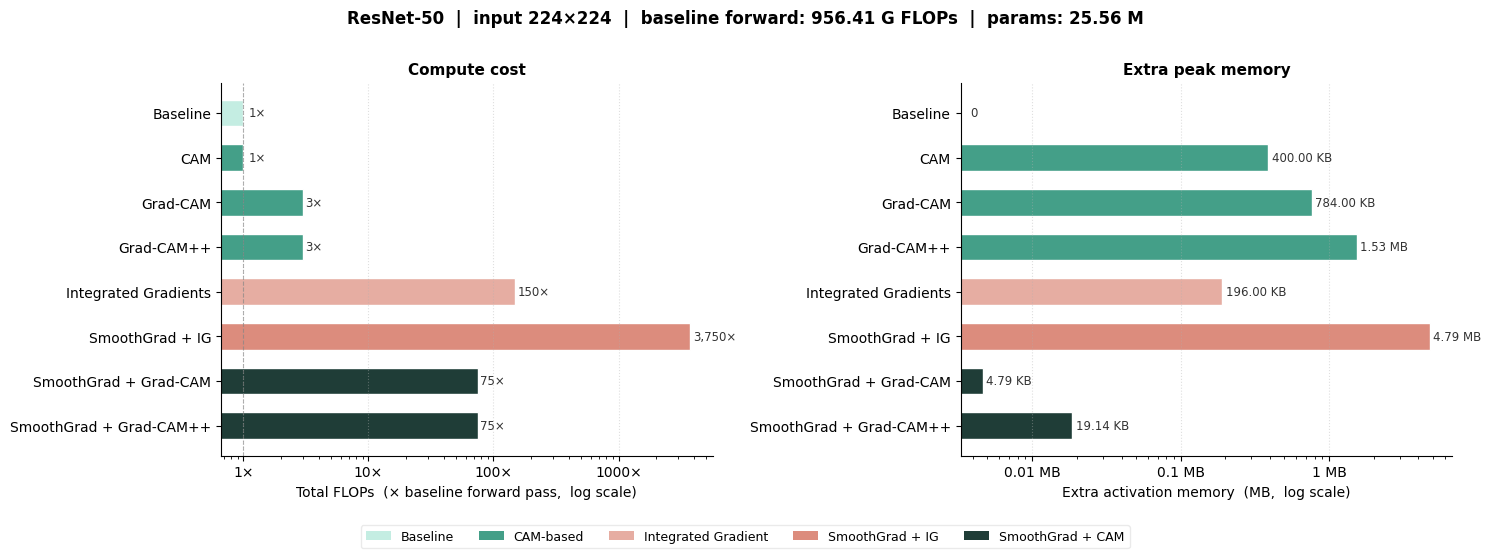
=== Static Example: Explanation Method Complexity ===

Model: ResNet-50
Input size: 224 × 224
Integrated Gradients steps (S): 50
SmoothGrad samples (N): 25

This plot compares different interpretability methods in terms of:
- Compute cost (FLOPs relative to a single forward pass)
- Additional memory required during execution

Notes:
- 'Baseline' corresponds to a standard forward pass
- Methods using gradients require forward + backward passes
- SmoothGrad multiplies cost by the number of noisy samples
Additional comments: - The implementations in this notebook are intentionally kept simple rather than fully optimized. Their goal is to illustrate the core mechanisms of each method and provide intuition through small, didactic examples, rather than to represent production-level or computationally optimized code.
- This notebook is intended for educational purposes. Feel free to experiment with the code, visualize different elements, or try alternative models. The best way to learn is by exploring and modifying the examples.